Minkowski spacetime explorer
See how space and time coordinates transform between inertial observers.
x′ = γ(x − βct) · ct′ = γ(ct − βx). The light cone stays fixed for all inertial frames.Events & trajectories
Keep several worldlines and events on the same spacetime diagram.
Add a spacetime event
Click an event in the list or on the diagram to select it. Drag to reposition.
Add a particle trajectory
Worldline: x = x₀ + (v/c)[ct − ct₀]. Values |v/c| > 1 depict spacelike, nonphysical particle tracks.
Diagram uses c = 1. Hold Shift and drag the canvas to pan; use +/− to zoom. The original cyan event E remains available.
Reading a Minkowski diagram
What it is
A Minkowski diagram is a drawing of spacetime. Position, x, runs across the page. Time runs up the page as ct, so that with c = 1 a year and a light-year are the same length. Light travels on the dashed lines, at 45 degrees.
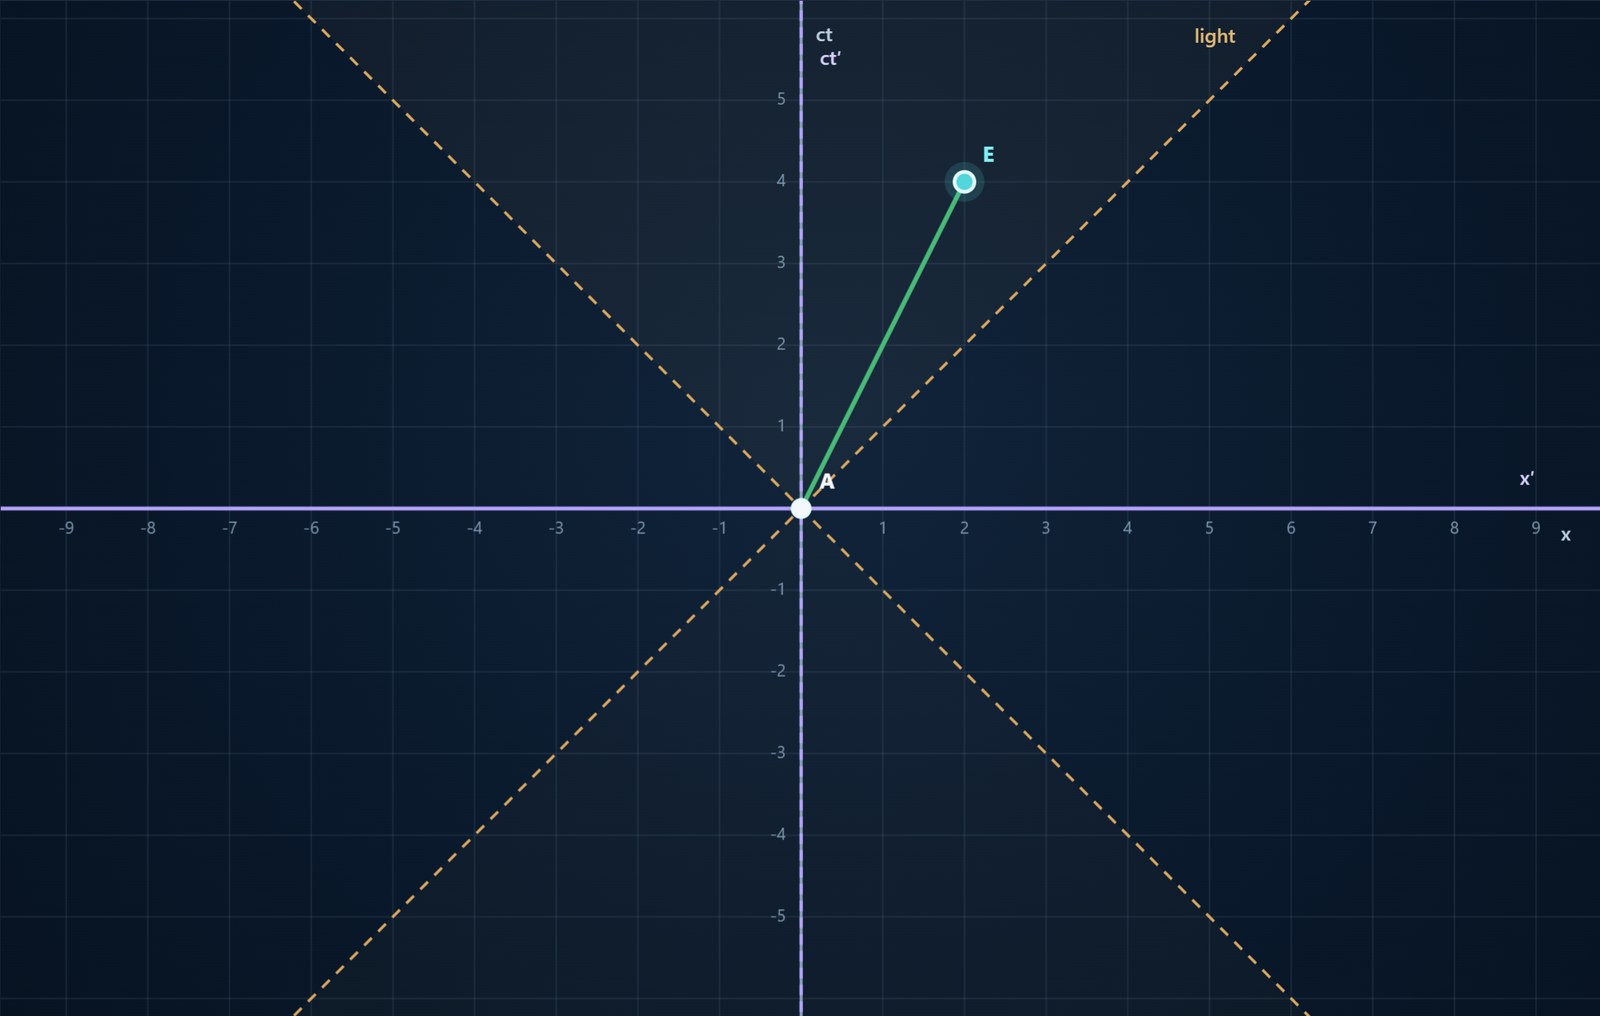
A point is an event: one place at one time. A line is a worldline, the history of one object. An object at rest is a vertical line. Motion tilts that line toward the light. A worldline with mass stays inside the light lines.
How to read it
The pale axes are x and ct for an observer at rest. The violet axes are x′ and ct′ for an observer moving at speed β along x. Change β and the violet axes tilt. The same event then has two pairs of coordinates, and the numbers under the diagram give both.
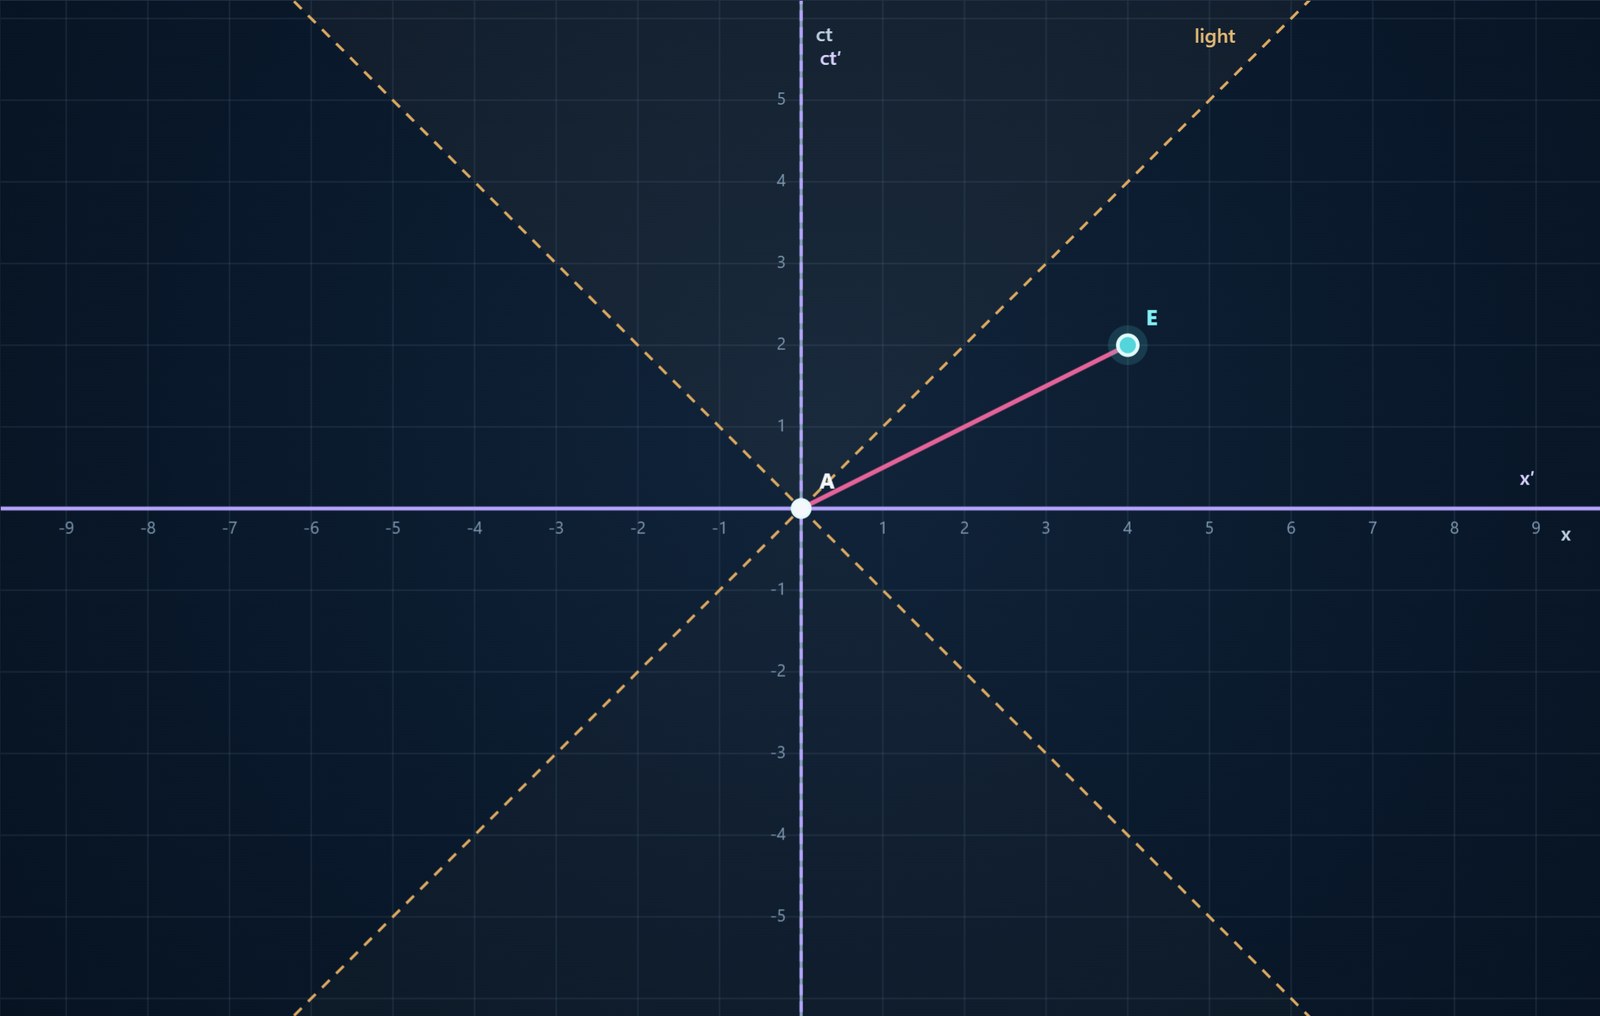
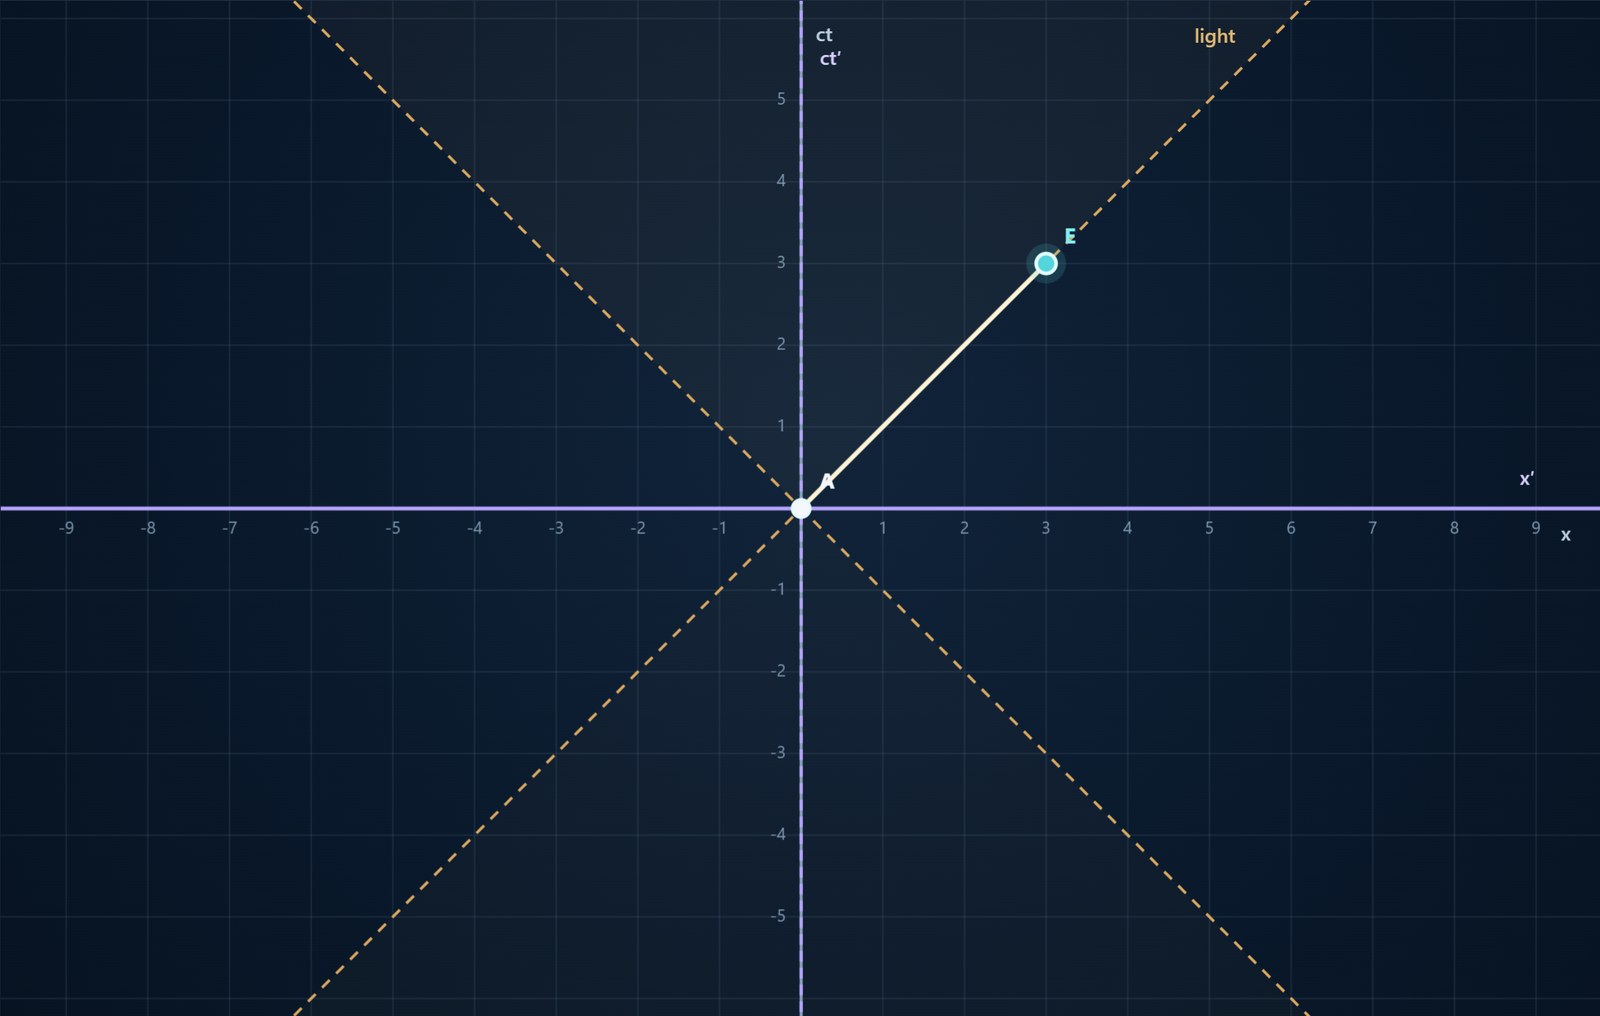
The gold dashed lines are light through the origin. The opening above the origin is its future. The opening below is its past. An event inside either opening can be joined to the origin by a signal slower than light. An event outside cannot.
What it is for
The diagram shows a Lorentz transformation directly. The tilted axes are the moving observer’s coordinates. Drag an event and both frames update together. The interval between two events, (cΔt)² − (Δx)², does not change from one inertial frame to another. Time dilation, length contraction, and disagreements about which events are simultaneous are different readings of that interval.
Time-like and space-like
These diagrams were made in the tool above, with the speed set to rest. The moving axes then lie on the stationary axes, and the light lines are at 45 degrees. A is the origin. E is the other event. The colored line joins them.